BMS Graphic Visualizations
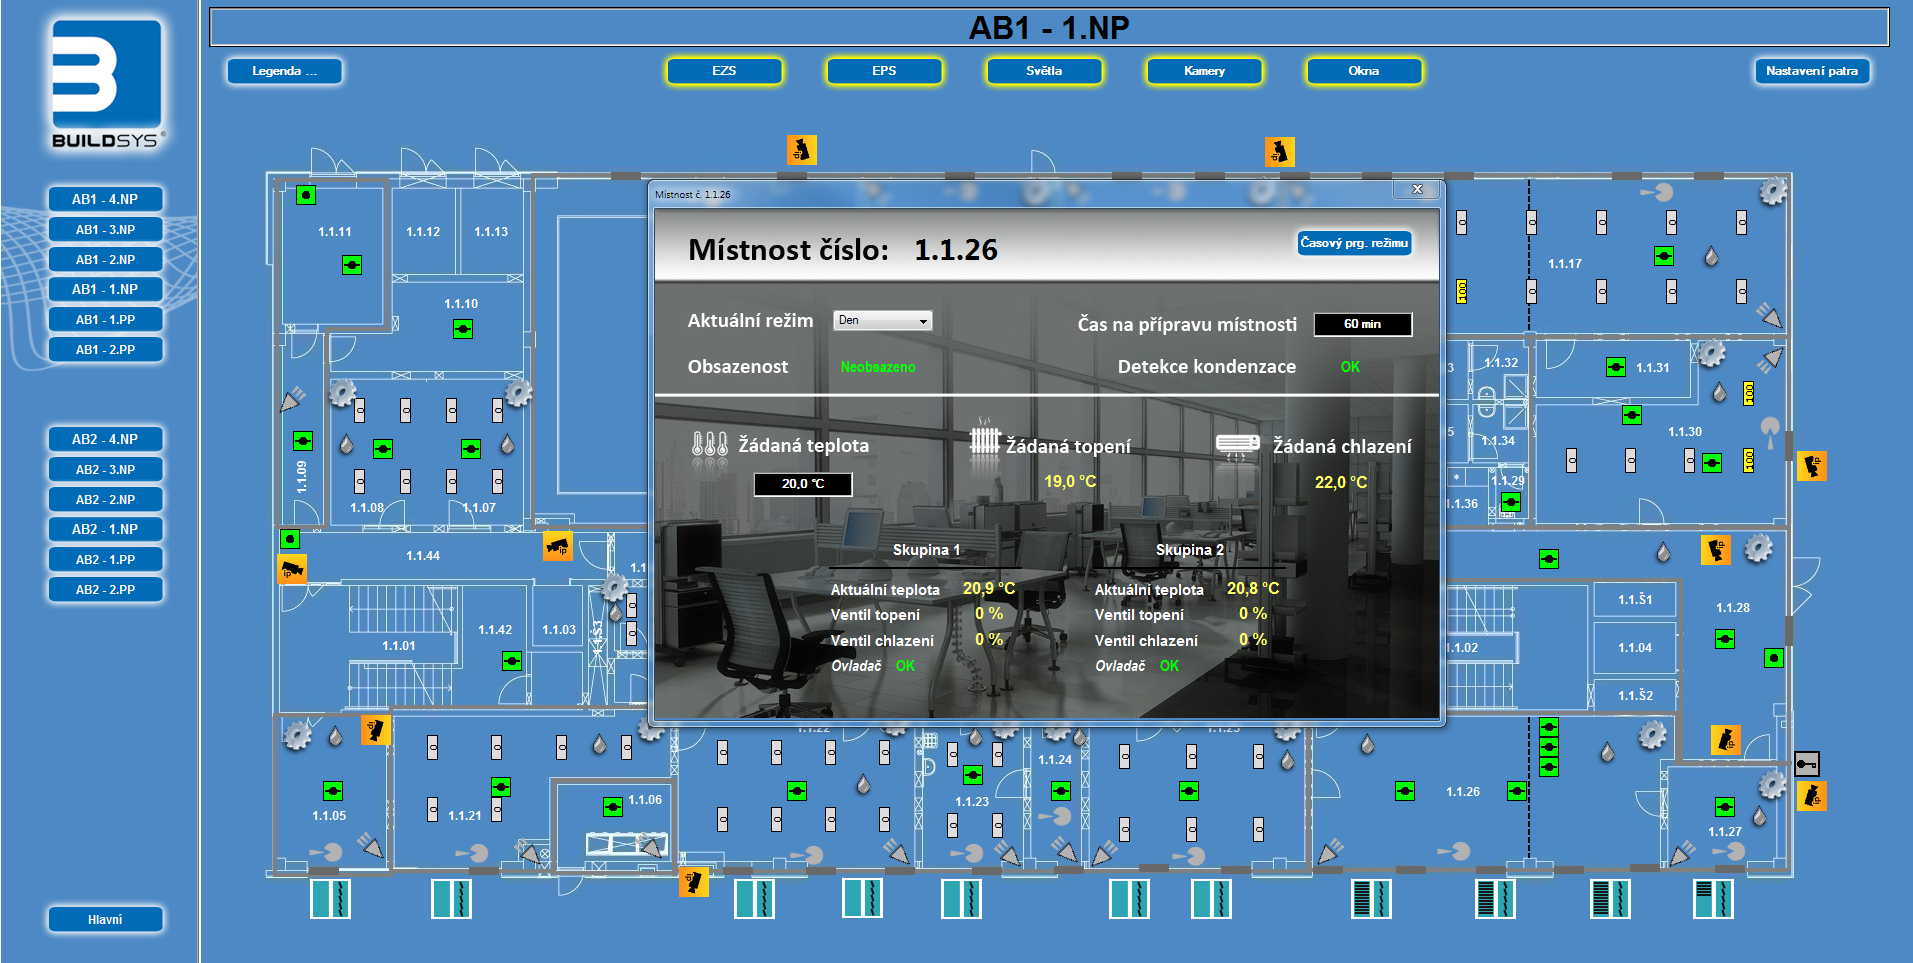
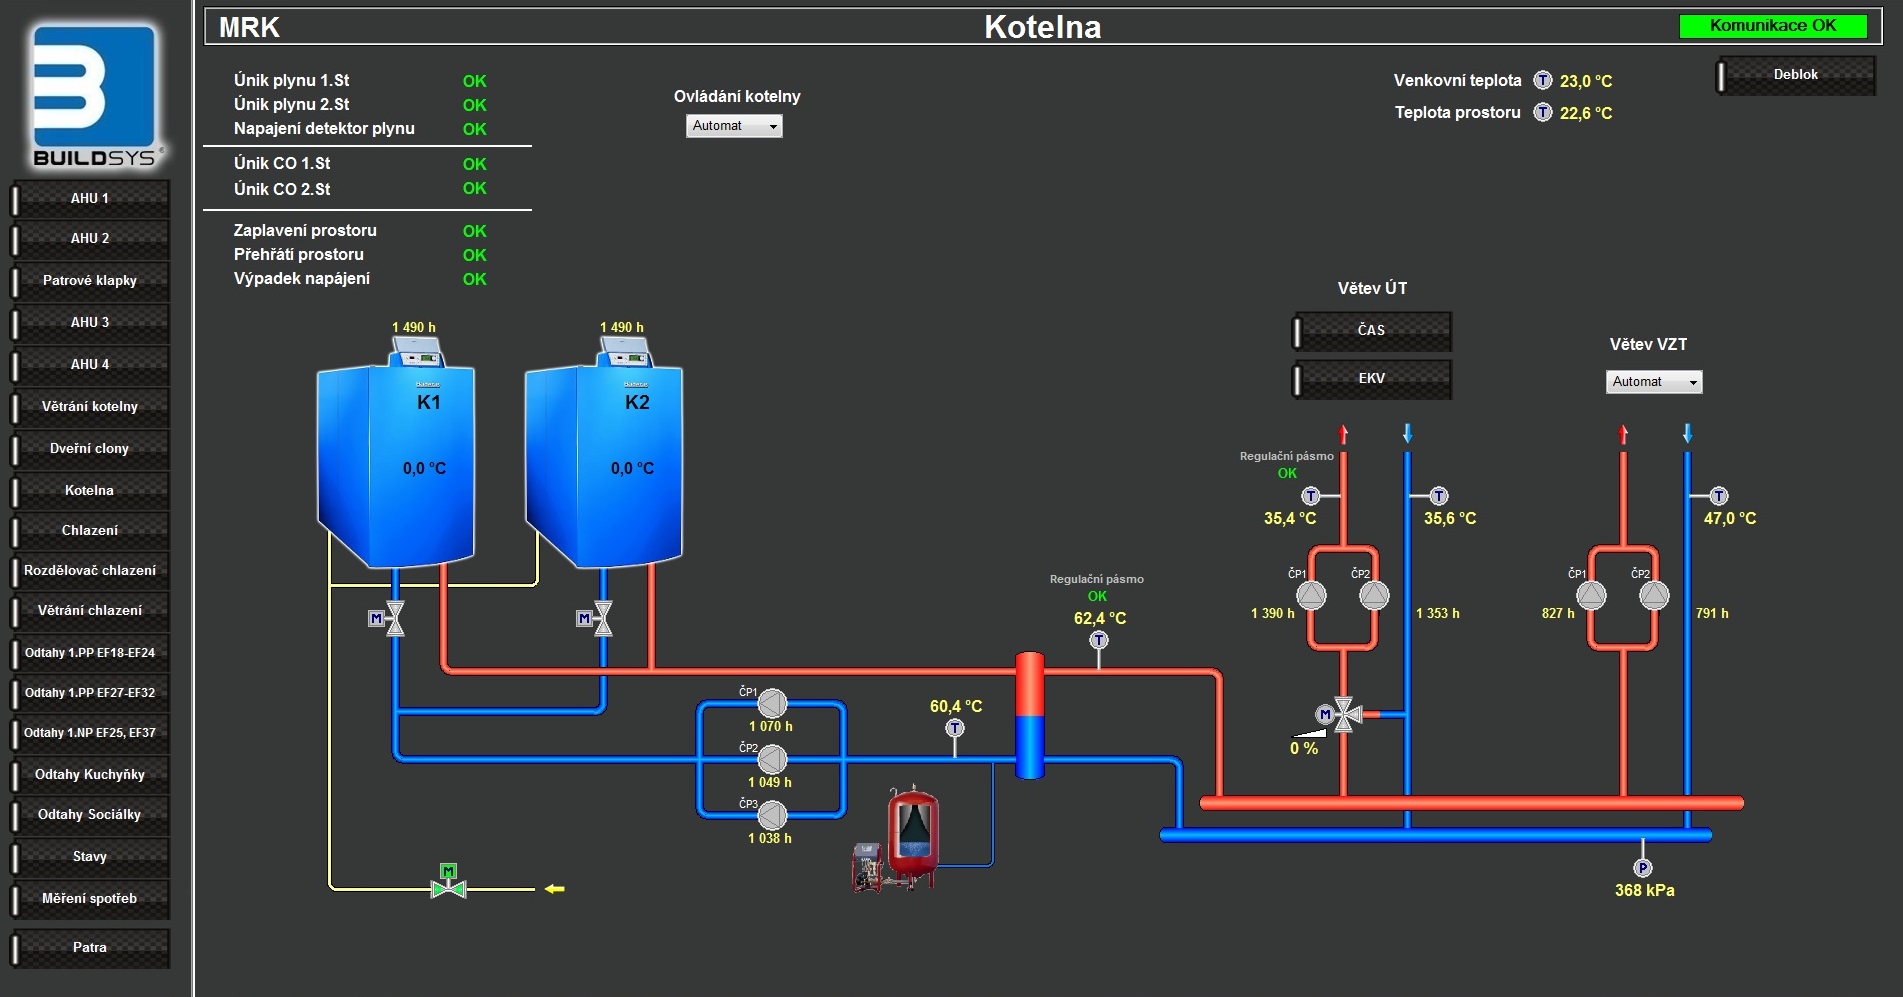
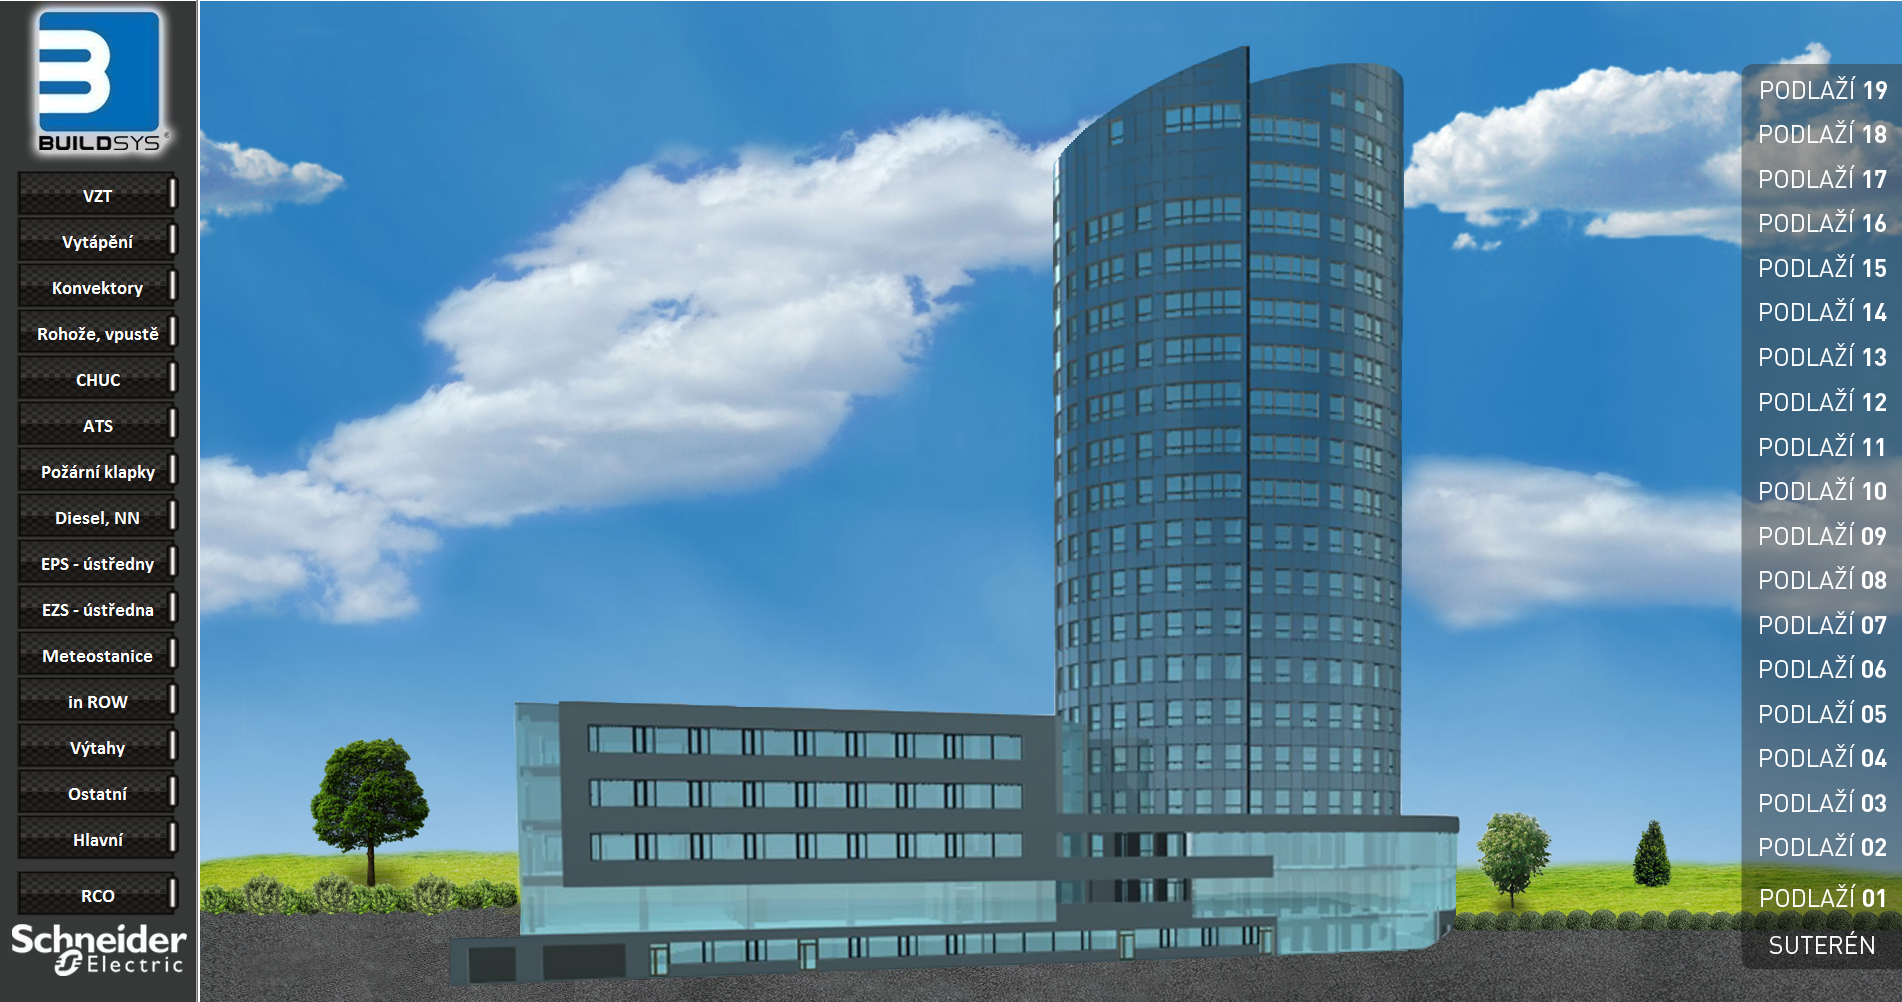
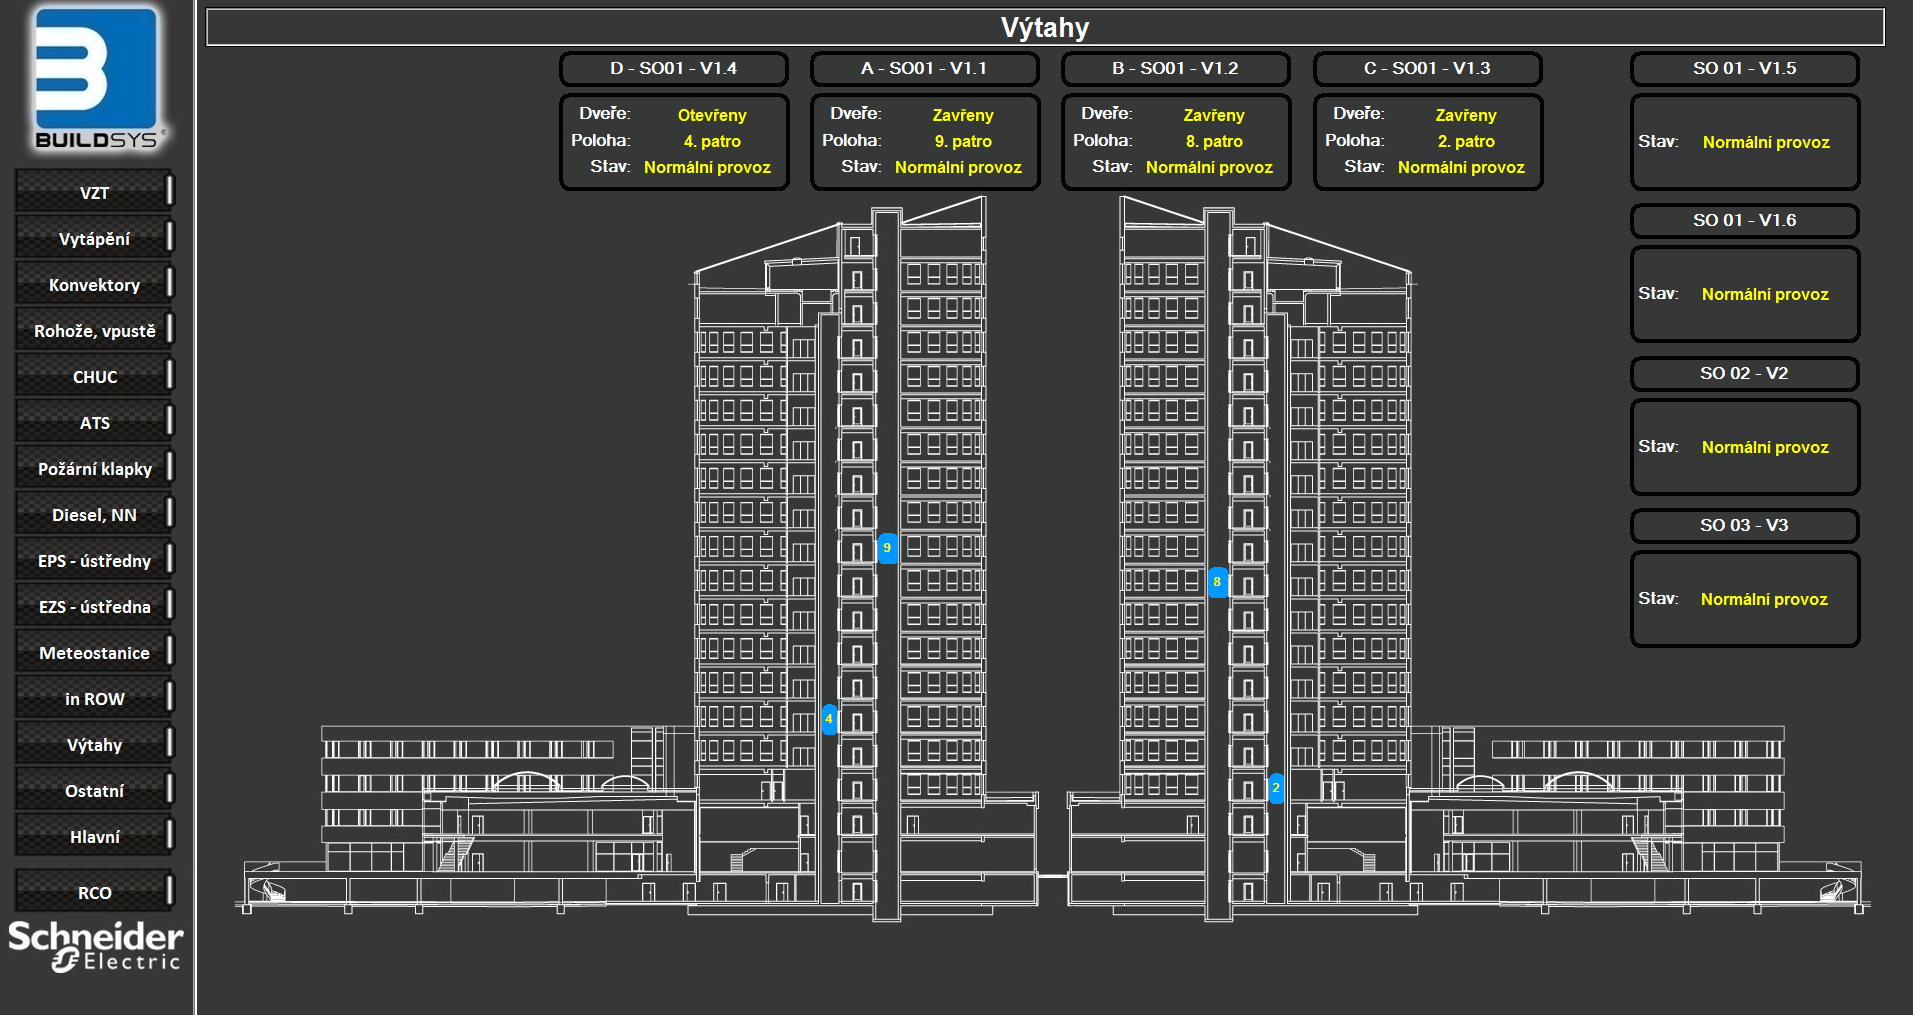
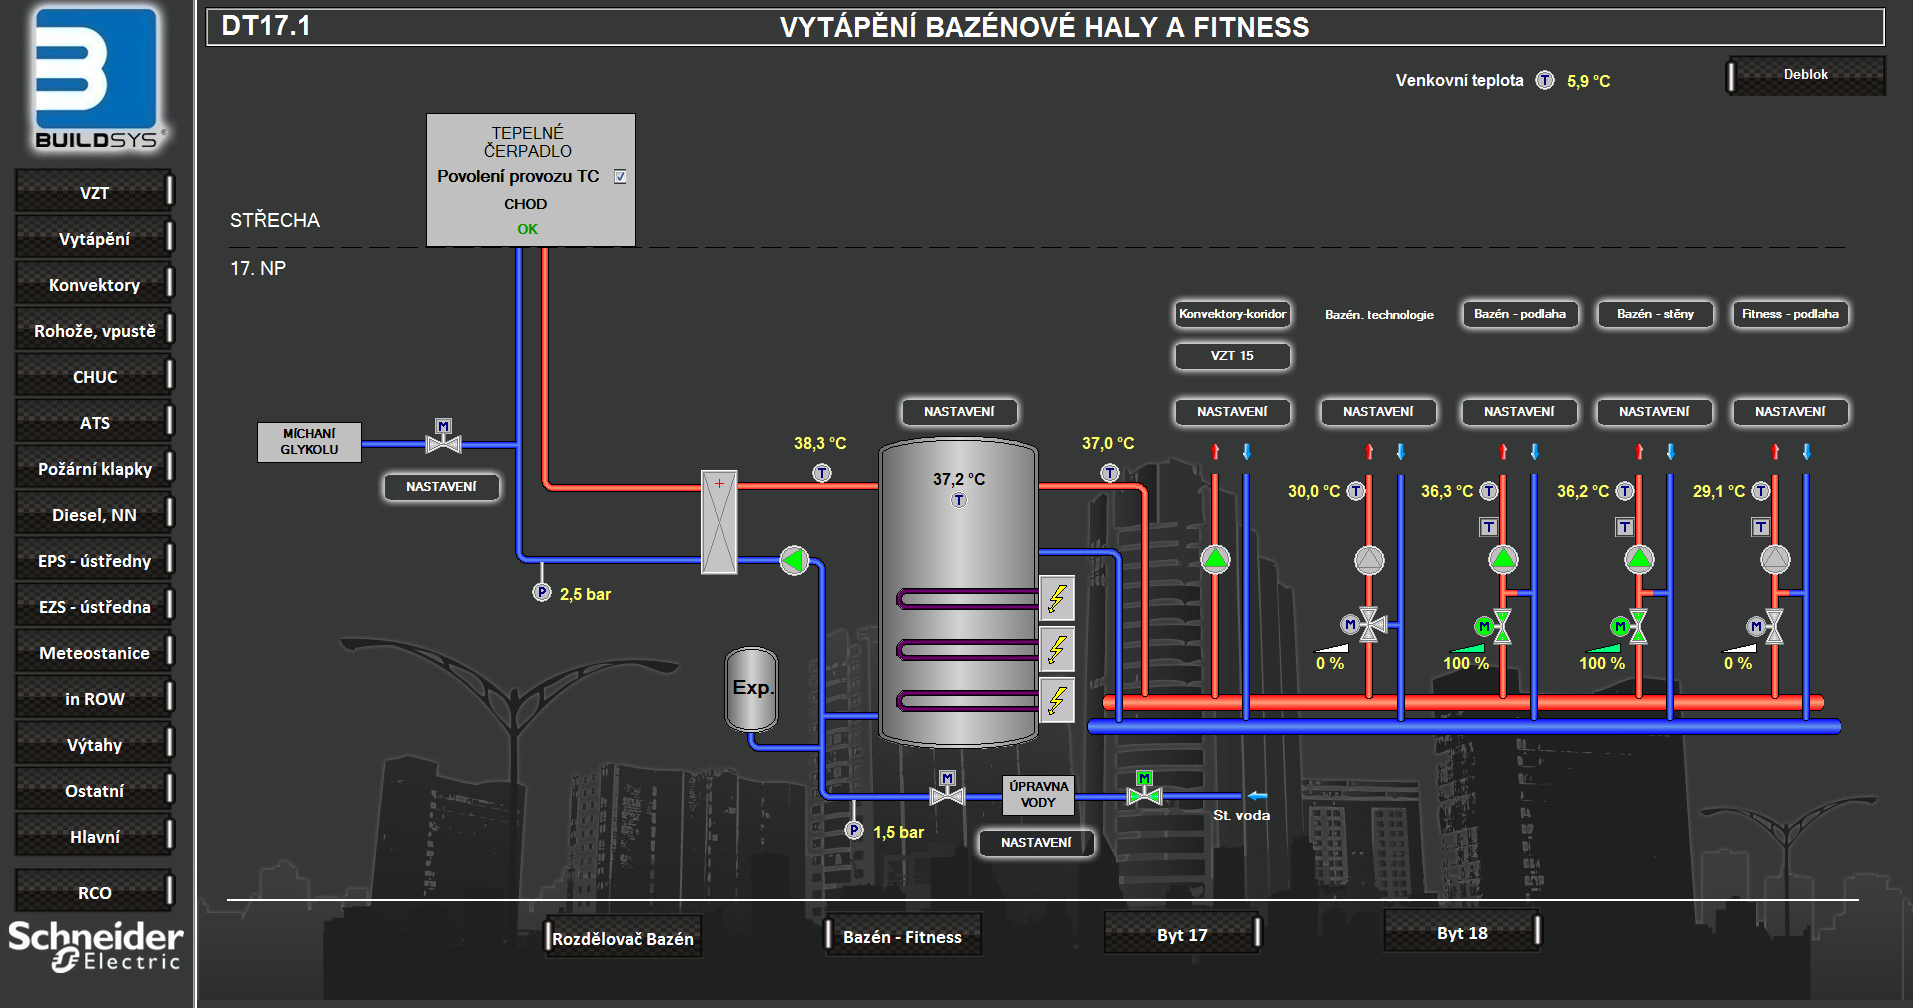
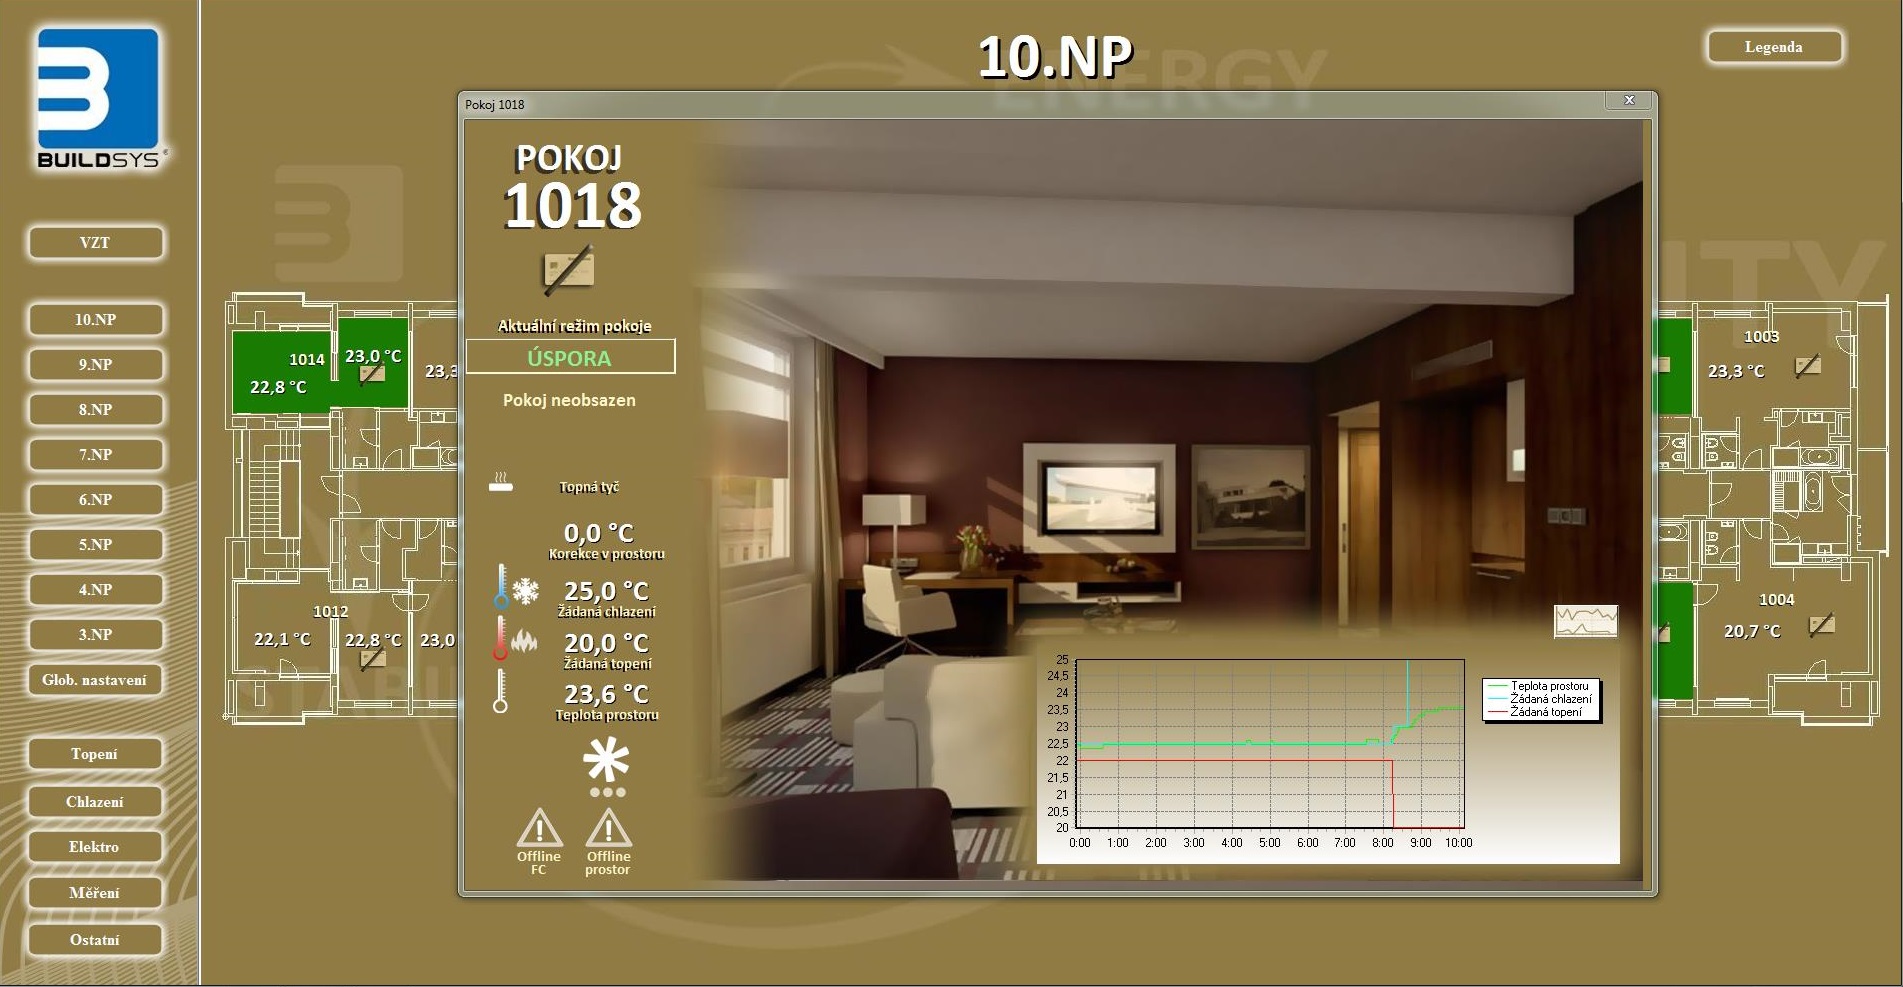
A building automation system (BMS - Building Management System) is a comprehensive tool designed for users and administrators of buildings (homes, offices, industrial buildings) for faster and easier operation and control management of technology equipments. Graphical visualizations give an overview of the values from sensors, switches, and allows the operator to change setpoints (eg. the desired temperature, securing rooms, monitoring the movement of people, etc.).
SCADA systems are typically installed on the host computer to which are imported measured values and data from individual sensors. There are created dipatching centers or workplaces for host computers, from which a service technician or maintanace staff can easily monitor and check the correct functioning of the system.
Nowadays, there is a possibility of distributing graphical visualizations to users who cannot be present or are not in the dispatching control center. In this case it is possible to use the internet website for transmition of graphical visualizations for viewing and / or controlling. Thus the control host computer gets its fixed IP address, which starts the internet service and anyone who is entitled to have an access can then view the graphical visualizations on his or her computer or cell phone.
Examples of BMS graphical visualizations
Office Center Jindřišská 16 Prague, Czech Republic

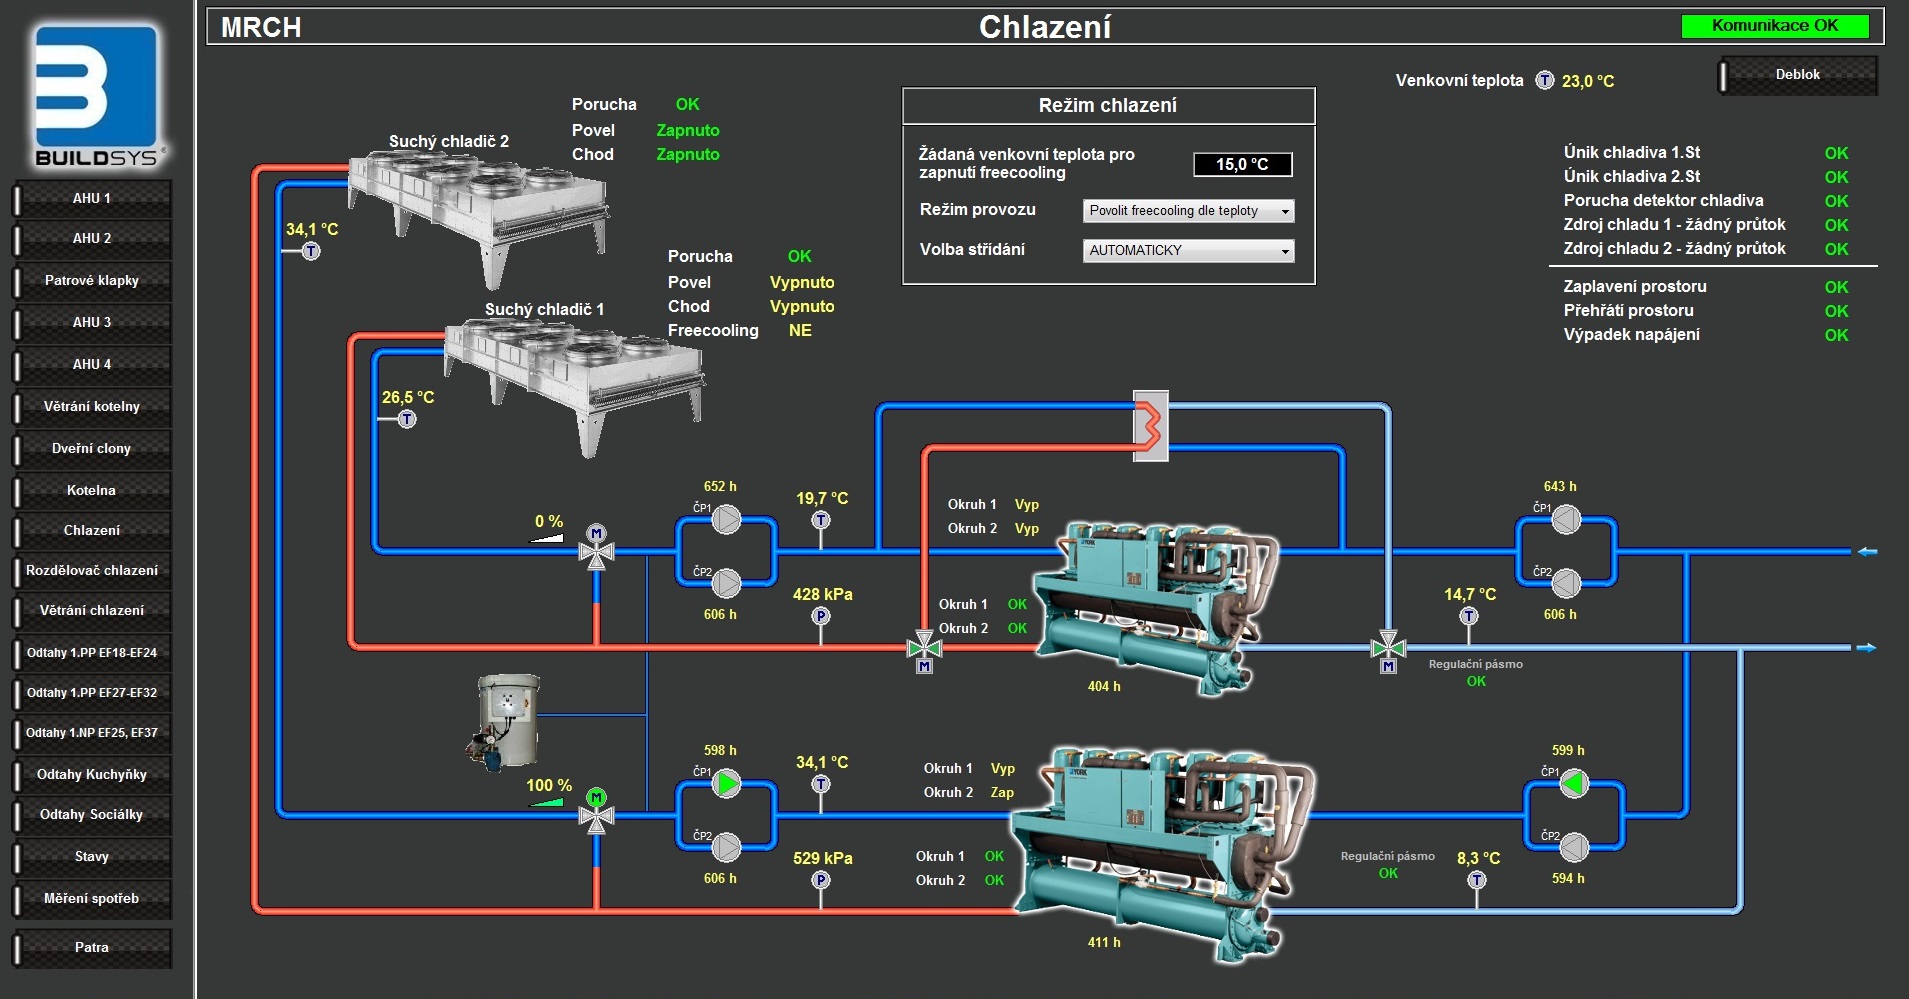

BEA Campus Olomouc, Czech Republic

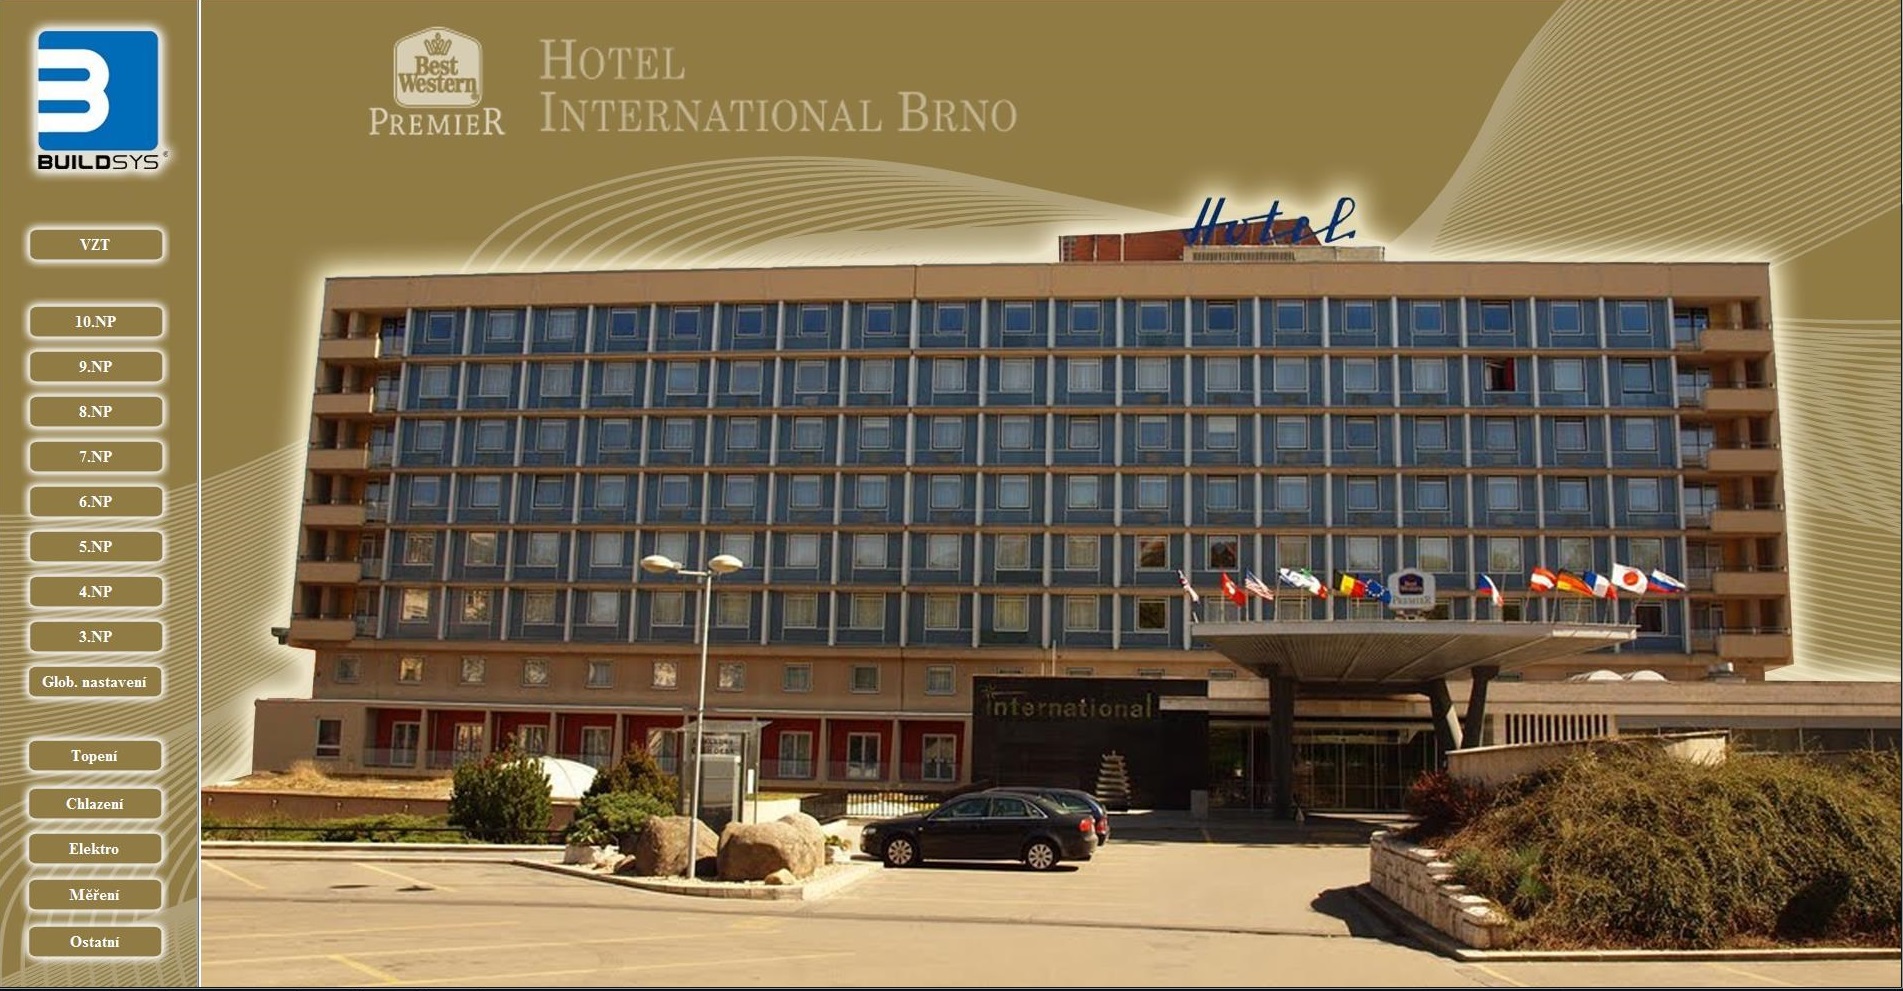
Hotel International Brno, Czech Republic


Science & Technology Park Unis Brno, Czech Republic